Project:
State Estimation of the Multi-Scale Lorenz 96 SystemA Hybrid ESN + EnKF Implementation
Project Overview:
This project explores state estimation using a hybrid approach that combines Echo State Networks (ESNs) with Ensemble Kalman Filtering (EnKF). We train and evaluate our model on noisy observations of the Multiscale Lorenz 96 system. This research was conducted as part of our capstone modeling course at, AM170B.
Scope Of Work:
1. Data Generation and Preprocessing:
We simulated the full Multiscale Lorenz 96 system (K=8, J=8, L=8) for 1.5 million timesteps, capturing chaotic dynamics across three coupled scales. The resulting 72-variable dataset was normalized and segmented into training and test splits, enabling consistent benchmarking of forecast accuracy across methods.
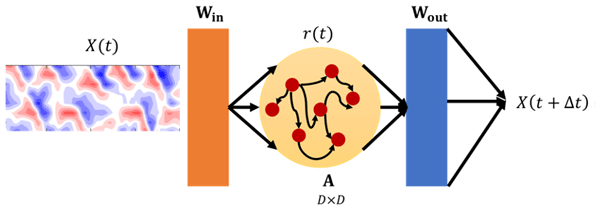
2. Model Development and Experimentation:
We implemented and evaluated multiple modeling strategies:
- An imperfect model omitting fast-scale variables for simplicity.
- A fully data-driven Echo State Network (ESN) with a 4992-node reservoir trained using ridge regression and nonlinear augmentation.
- A hybrid approach combining model outputs with ESN predictions, tested across three coupling configurations.
3. Forecast Evaluation and Metrics:
Performance was tracked using normalized root-mean-square error (NRMSE), valid time (prediction horizon until NRMSE > 0.4), and mean error over time. The imperfect model achieved ~356 valid timesteps, while the ESN averaged ~195. We also measured standard deviation and plotted confidence intervals to visualize prediction reliability.
4. EnKF Integration for State Estimation:
We applied an Ensemble Kalman Filter (EnKF) to correct both imperfect and ESN forecasts using noisy observations. Each filter used 100 ensemble members and ran across a 4×4 grid of hyperparameters: observation intervals of [1, 5, 10, 20] and noise variances of [0.05, 0.1, 0.5, 1.0]. Performance was evaluated over 10 trials per configuration.
5. Hyperparameter Analysis and Visualization:
We presented individual trial plots, average NRMSE curves, and bar charts measuring the percentage of timesteps under the NRMSE threshold. This revealed the trade-off between observation frequency and data noise — frequent, low-noise updates yielded >90% of timesteps with NRMSE < 0.4, while sparse or noisy observations caused filter drift.
6. Reproducible Implementation and Interpretation:
The entire workflow was implemented in Python using NumPy, SciPy, and custom EnKF scripts. Visualizations were used to clearly communicate model accuracy and breakdown failure points. Metrics like valid time and shaded standard deviation bands added interpretability for comparing model robustness under uncertainty.

